PCA
A wrapper for conducting 2D and 3D Principal Component Analysis.
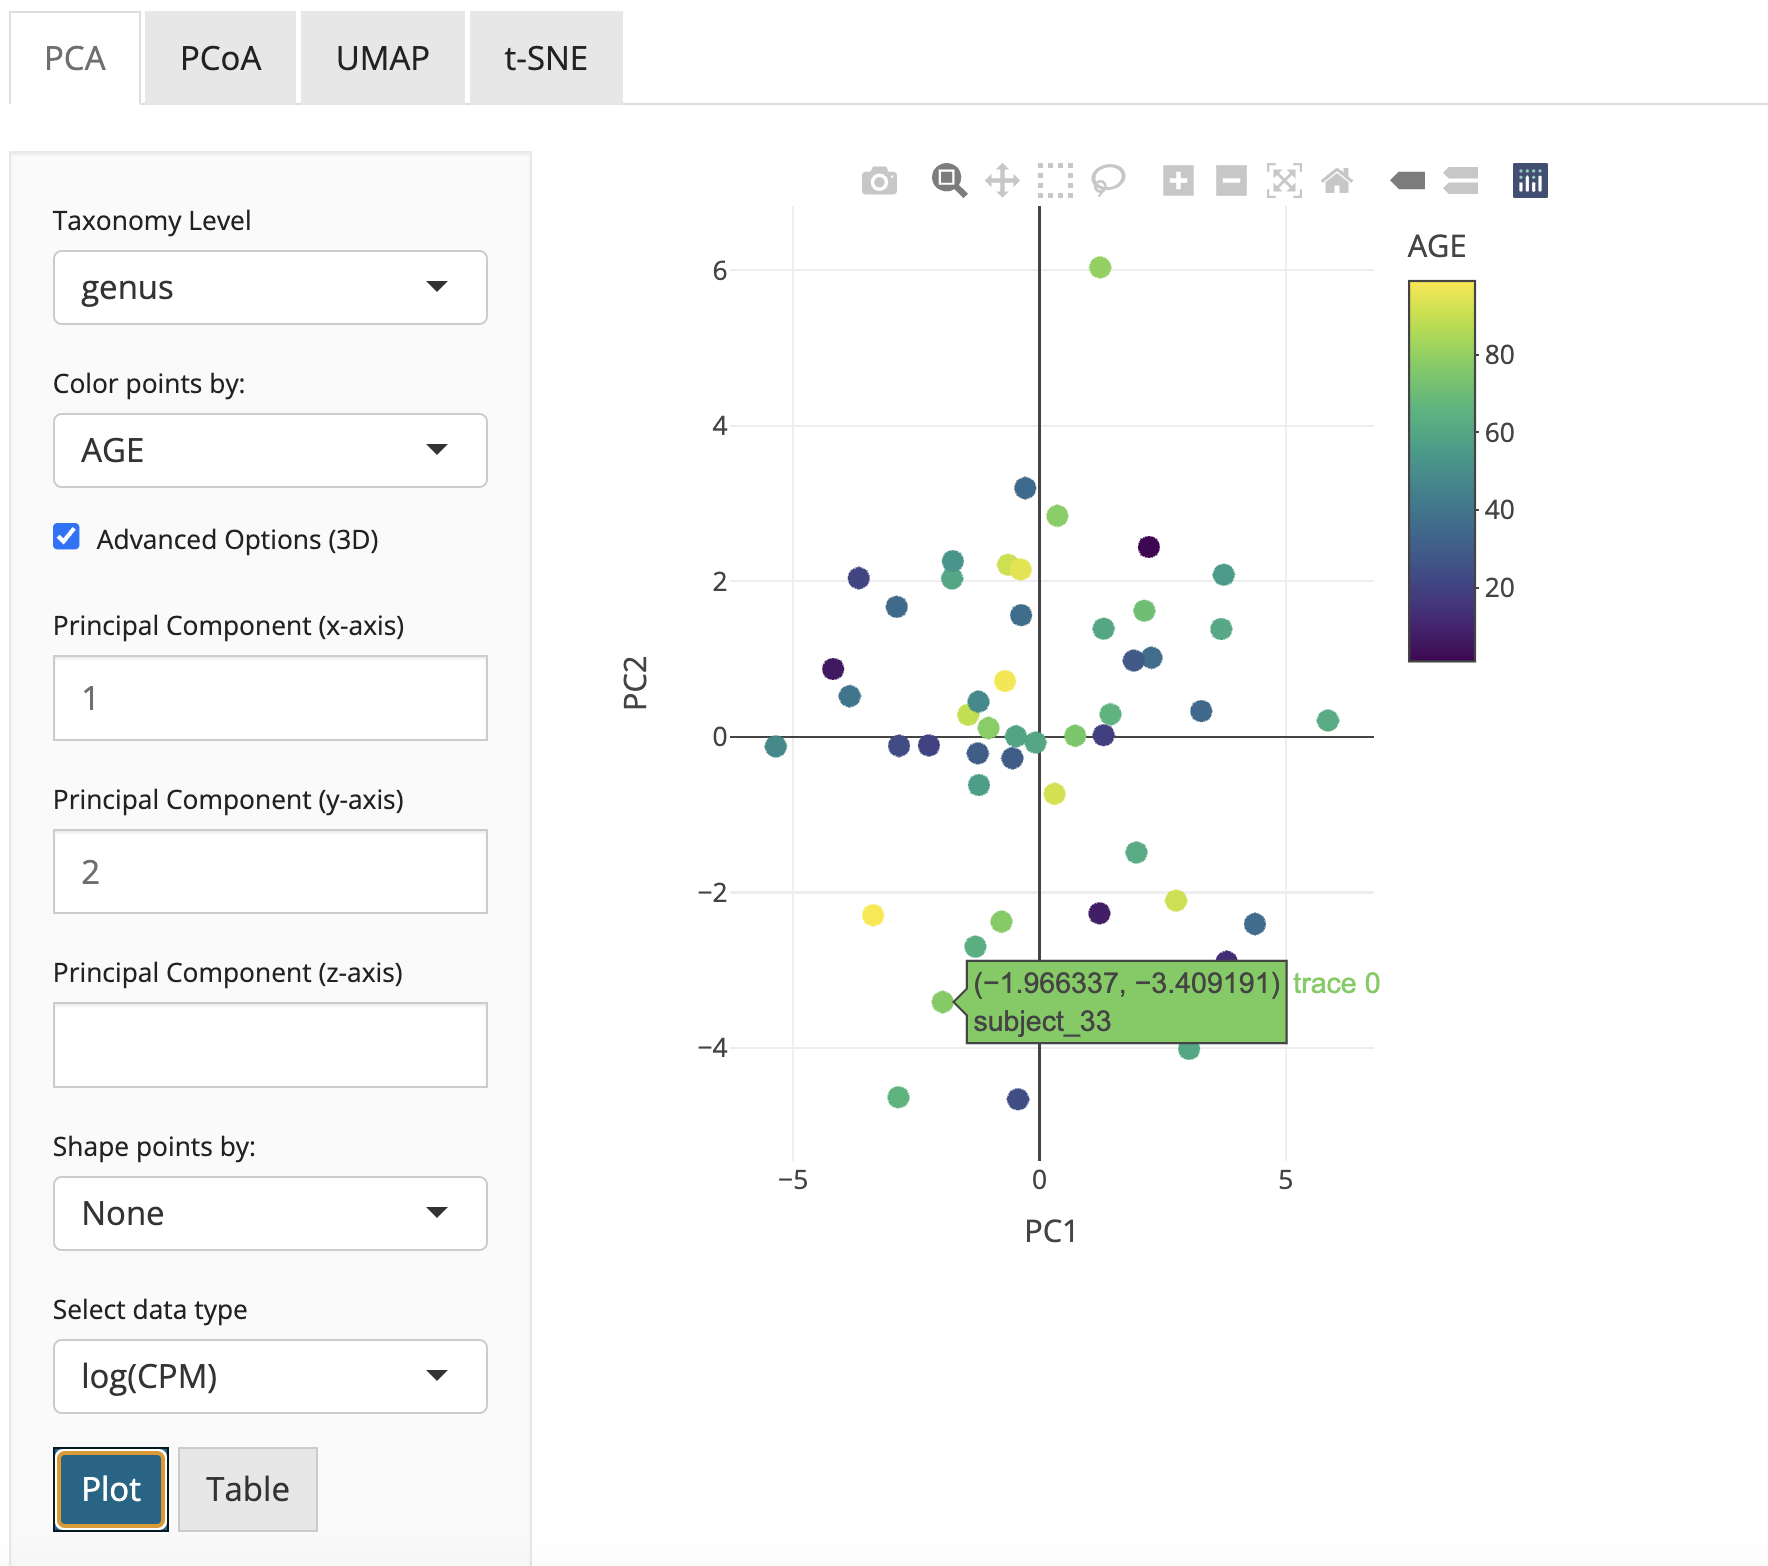
Instructions:
- Select one or more taxonomy levels in the menu (default is genus)
- Color data points by a condition
- Select variable on x-axis (default is PC1)
- Select variable on y-axis (default is PC1)
- (Optional) Select variable on z-axis for 3D plotting
- (Optional) Shape data points by a condition
- (Optional) Select a datatype to use
- Click the button “Plot” to plot
- Click the button “Table” to see PCA data
PCoA
A wrapper for conducting 2D and 3D Principal Coordinate Analysis.
Instructions:
- Select one or more taxonomy levels in the menu (default is genus)
- Color data points by a condition
- Select variable on x-axis (default is PC1)
- Select variable on y-axis (default is PC1)
- (Optional) Select variable on z-axis for 3D plotting
- (Optional) Shape data points by a condition
- (Optional) Select a distance metric to use
- Click the button “Plot” to plot
- Click the button “Table” to see PCoA data

UMAP
A wrapper for conducting 2D and 3D Uniform Manifold Approximation and Projection.
Instructions:
- Select one or more taxonomy levels in the menu (default is genus)
- Color data points by a condition
- Select variable on x-axis (default is C1)
- Select variable on y-axis (default is C1)
- (Optional) Select variable on z-axis for 3D plotting
- (Optional) Shape data points by a condition
- (Optional) Choose number of nearest neighbors
- (Optional) Select a distance function
- (Optional) Choose number of iterations
- (Optional) Initialize embedding space
- (Optional) Determines how close points appear in the final layout
- (Optional) Select a datatype to use
- Click the button “Plot” to plot

t-SNE
A wrapper for conduction 2D and 3D t-distributed stochastic neighbor embedding.
Instructions:
- Select one or more taxonomy levels in the menu (default is genus)
- Color data points by a condition
- (Optional) Select final dimensions (2D or 3D)
- (Optional) Shape data points by a condition
- (Optional) Select t-SNE perplexity
- (Optional) Select t-SNE initial dimensions
- (Optional) Select a datatype to use
- Click the button “Plot” to plot
- Select “Use Cached Data” to change color/shape of data points without re-running t-SNE
