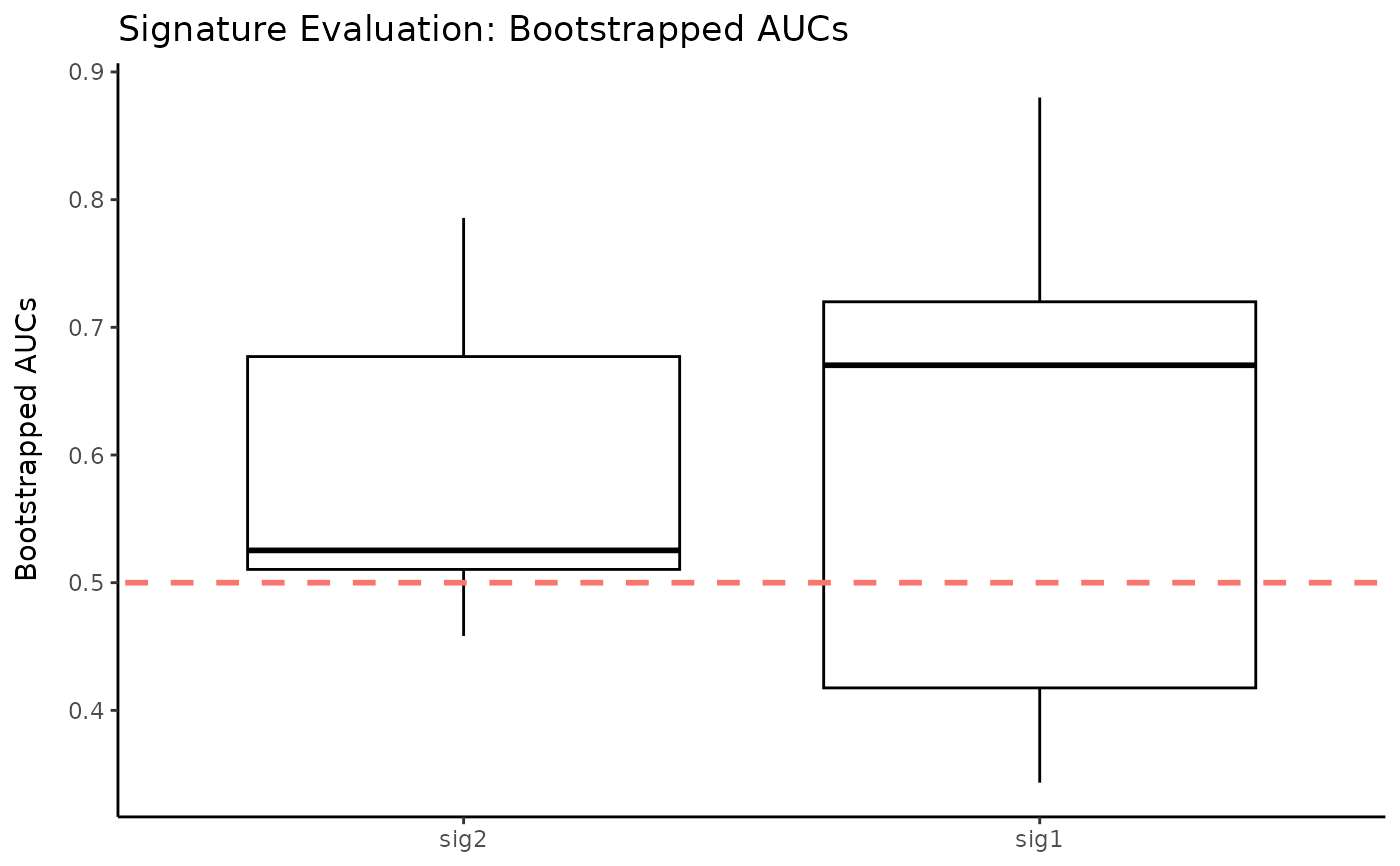
Create a boxplot using logistic regression and bootstrap LOOCV to evaluate signatures.
Source:R/evaluate.R
plotQuantitative.RdThis function takes as input a data.frame with genetic expression
count data, and uses a bootstrapped leave-one-out cross validation procedure
with logistic regression to allow for numeric and graphical comparison
across any number of genetic signatures. It creates a boxplot of bootstrapped
AUC values.
Usage
plotQuantitative(
  df.input,
  targetVec.num,
  signature.list = NULL,
  signature.name.vec = NULL,
  num.boot = 100,
  pb.show = TRUE,
  name = "Signature Evaluation: Bootstrapped AUCs",
  fill.col = "white",
  outline.col = "black",
  abline.col = "red",
  rotateLabels = FALSE
)
Arguments
- df.input
a
data.frameof gene expression count data. Required.- targetVec.num
a numeric binary vector of the response variable. The vector should be the same number of rows as
df. Required.- signature.list
a
listof signatures to run with their associated genes. This list should be in the same format asTBsignatures, included in the TBSignatureProfiler package. Ifsignature.list = NULL, the default set of signaturesTBsignatureslist is used. For details, run?TBsignatures.- signature.name.vec
A vector specifying the names of the signatures to be compared. This should be the same length as
signature.list. Ifsignature.name.vec = NULL, the default set of signaturesTBsignatureslist is used.- num.boot
an integer specifying the number of bootstrap iterations.
- pb.show
logical. If
TRUEthen a progress bar for the bootstrapping procedure will be displayed as output. The default isTRUE.- name
a character string giving a name for the outputted boxplot of bootstrapped AUCs. The default is
"Signature Evaluation: Bootstrapped AUCs".- fill.col
the color to be used to fill the boxplots. The default is
"white".- outline.col
the color to be used for the boxplot outlines. The default is
"black".- abline.col
the color to be used for the dotted line at AUC = 0.5 (the chance line). The default is
"red".- rotateLabels
logical. If
TRUE, the x-axis labels will be rotated. The default isFALSE.
Examples
inputTest <- matrix(rnorm(1000), 100, 20,
                    dimnames = list(paste0("gene", seq.int(1, 100)),
                                    paste0("sample", seq.int(1, 20))))
inputTest <- as.data.frame(inputTest)
targetVec <- sample(c(0,1), replace = TRUE, size = 20)
signature.list <- list(sig1 = c("gene1", "gene2", "gene3"),
                       sig2 = c("gene4", "gene5", "gene6"))
signature.name.vec <- c("sig1", "sig2")
num.boot <- 5
plotQuantitative(inputTest, targetVec.num = targetVec,
                 signature.list = signature.list,
                 signature.name.vec = signature.name.vec,
                 num.boot = num.boot, rotateLabels = FALSE)
#>
  |
  |                                                                      |   0%
  |
  |===================================                                   |  50%
  |
  |======================================================================| 100%
