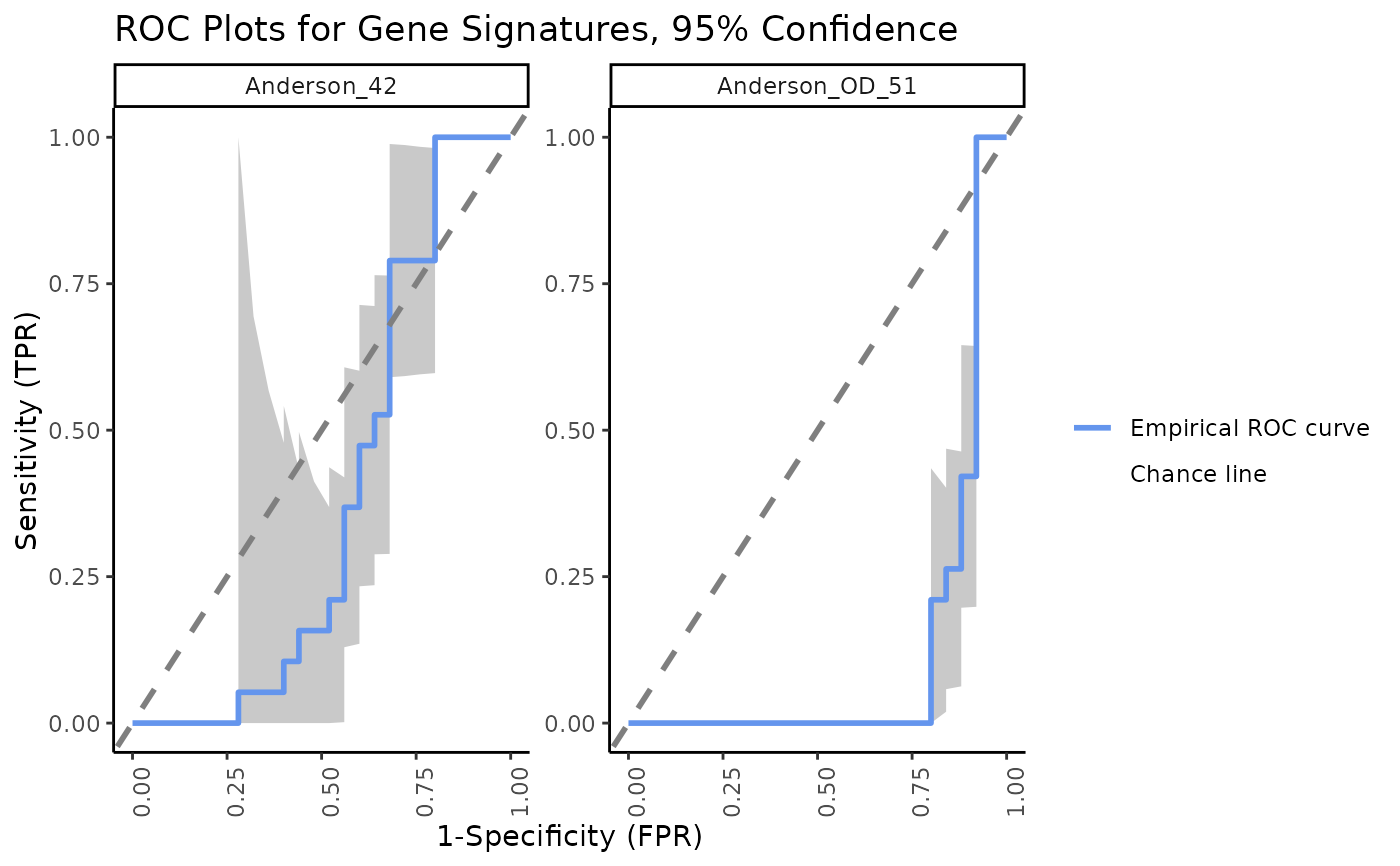
Create an array of ROC plots with confidence interval bands to compare signatures.
Source:R/bootstrap.R
signatureROCplot_CI.RdCreate an array of ROC plots with confidence interval bands to compare signatures.
Usage
signatureROCplot_CI(
  inputData,
  annotationData,
  signatureColNames,
  annotationColName,
  scale = FALSE,
  choose_colors = c("cornflowerblue", "gray50", "gray79"),
  name = NULL,
  nrow = NULL,
  ncol = NULL,
  ci.lev = 0.95,
  pb.show = TRUE
)
Arguments
- inputData
an input data object. It should either be of the class
SummarizedExperimentand contain the profiled signature data and annotation data as columns in thecolData, or alternatively be of the classesdata.frameormatrixand contain only the gene expression data. Required.- annotationData
a
data.frameormatrixof annotation data, with one column. Only required ifinputDatais adata.frameormatrixof signature data.- signatureColNames
a
vectorof the column names ofinputDatathat contain the signature data. IfinputDatais aSummarizedExperimentobject, these are the column names of the objectcolData.- annotationColName
a character string naming the column name in the
colDatathat contains the annotation data to be used in making the boxplot. Only required if inputData is aSummarizedExperimentobject.- scale
logical. Setting
scale = TRUEscales the signature data. The default isFALSE.- choose_colors
a vector of length 3 defining the colors to be used in the ROC plots. The default is
c("cornflowerblue", "gray50", "gray79").- name
a character string giving the title of the ROC plot. If
NULL, the plot title will be"ROC Plots for Gene Signatures, <ci.lev>% Confidence". The default isNULL.- nrow
integer giving the number of rows in the resulting array.
- ncol
integer giving the number of columns in the resulting array.
- ci.lev
a number between 0 and 1 giving the desired level of confidence for computing ROC curve estimations.
- pb.show
logical for whether to show a progress bar while running code. The default is
TRUE.
Examples
# Run signature profiling

 choose_sigs <- TBsignatures[c(1, 2)]
 prof_indian <- runTBsigProfiler(TB_indian, useAssay = "logcounts",
                                 algorithm = "Zscore",
                                 signatures = choose_sigs,
                                 parallel.sz = 1)
#> Parameter update_genes is TRUE. Gene names will be updated.
#> Running Zscore
#> ! 1 genes with constant values throughout the samples
#> ! Genes with constant values are discarded

# Create ROC plots with confidence intervals
signatureROCplot_CI(prof_indian, signatureColNames = names(choose_sigs),
                    annotationColName = "label")
#>
  |
  |                                                                      |   0%
  |
  |===================================                                   |  50%
  |
  |======================================================================| 100%