This function takes a dataset of scored gene expression data as an input
and returns a ComplexHeatmap plot for for visual comparison of
signature performance. The function takes arguments listed here as well
as any others to be passed on to ComplexHeatmap::Heatmap().
Usage
signatureHeatmap(
  inputData,
  annotationData = NULL,
  name = "Signatures",
  signatureColNames,
  annotationColNames = NULL,
  colList = list(),
  scale = FALSE,
  showColumnNames = TRUE,
  showRowNames = TRUE,
  colorSets = c("Set1", "Set2", "Set3", "Pastel1", "Pastel2", "Accent", "Dark2",
    "Paired"),
  choose_color = c("blue", "gray95", "red"),
  split_heatmap = "none",
  annotationSignature = sigAnnotData,
  column_order = NULL,
  ...
)
Arguments
- inputData
an input data object. It should either be of the class
SummarizedExperimentand contain the profiled signature data and annotation data as columns in the colData, or alternatively be of the classesdata.frameormatrixand contain only the gene expression data. Required.- annotationData
a
data.frameormatrixof annotation data, with one column. Only required ifinputDatais adata.frameormatrixof signature data. The row names must equal those of theinputDatacolumn names. Default isNULL.- name
a character string with the plot title of the heatmap. The default is
"Signatures".- signatureColNames
a vector of the column names in
colDatathat contain the signature data. Only required ifinputDatais a SummarizedExperiment object.- annotationColNames
a vector of the column names in
colDatathat contain the annotation data. Only required ifinputDatais aSummarizedExperiment. Default isNULL.- colList
a named
listof named vectors specifying custom color information to pass toComplexHeatmap::Heatmap(). The list should have as many elements as there are annotation columns, and each element name should correspond exactly with the name of each annotation column. The colors in the vector elements should be named according to the levels of the factor in that column's annotation data if the annotation is discrete, or it should be produced withcirclize::colorRamp2if the annotation is continuous. By default,ColorBrewercolor sets will be used. See the the parametercolorSetsfor additional details.- scale
logical. Setting
scale = TRUEscales the signature data. The default isFALSE.- showColumnNames
logical. Setting
showColumnNames = TRUEwill show the column names (i.e. sample names) on the heatmap. The default isTRUE.- showRowNames
logical. Setting
showColumnNames = TRUEwill show the row names (i.e. signature names) on the heatmap. The default isTRUE.- colorSets
a vector of names listing the color sets in the order that they should be used in creating the heatmap. By default, this function will use the color sets in the order listed in
Usagefor annotation information. You may replace the default with the same collection of sets in order that you want to use them, or provide custom color sets with thecolListparameter.- choose_color
a vector of color names to be interpolated for the heatmap gradient, or a
colorRampfunction produced bycirclize::colorRamp2. The default isc("blue", "gray95", "red").- split_heatmap
a character string either giving the column title of
annotationSignaturecontaining annotation data for which to split the heatmap rows (i.e., signatures), or"none"if no split is desired. To split based on the type of signature, setsplit_heatmap = "disease". The default is"none".- annotationSignature
a
data.frameormatrixwith information to be used in splitting the heatmap. The first column should signature names. The column of annotation information should be specified insplit_heatmap.Other columns will be ignored. The default issigAnnotData.- column_order
a vector of character strings indicating the order in which to manually arrange the heatmap columns. Default is
NULL, such that column order is automatically determined via clustering.- ...
Additional arguments to be passed to
ComplexHeatmap::Heatmap().
Details
If both annotationData = NULL and annotationColNames = NULL,
no annotation bar will be drawn on the heatmap.
Examples
library(SummarizedExperiment)
# Generate some artificial data that shows a difference in Zak_RISK_16
mat_testdata <- rbind(matrix(c(rnorm(80), rnorm(80) + 5), 16, 10,
dimnames = list(TBsignatures$Zak_RISK_16,
paste0("sample", seq_len(10)))),
matrix(rnorm(1000), 100, 10,
dimnames = list(paste0("gene", seq_len(100)),
paste0("sample", seq_len(10)))))
# Create a SummarizedExperiment object that contains the data
testdataSE <- SummarizedExperiment(assays = SimpleList(data = mat_testdata),
colData = DataFrame(sample =
c(rep("down", 5),
rep("up", 5))))
res <- runTBsigProfiler(testdataSE, useAssay = "data",
signatures = TBsignatures["Zak_RISK_16"],
algorithm = c("GSVA", "ssGSEA"), parallel.sz = 1,
combineSigAndAlgorithm = TRUE)
#> Parameter update_genes is TRUE. Gene names will be updated.
#> Running GSVA
#> Running ssGSEA
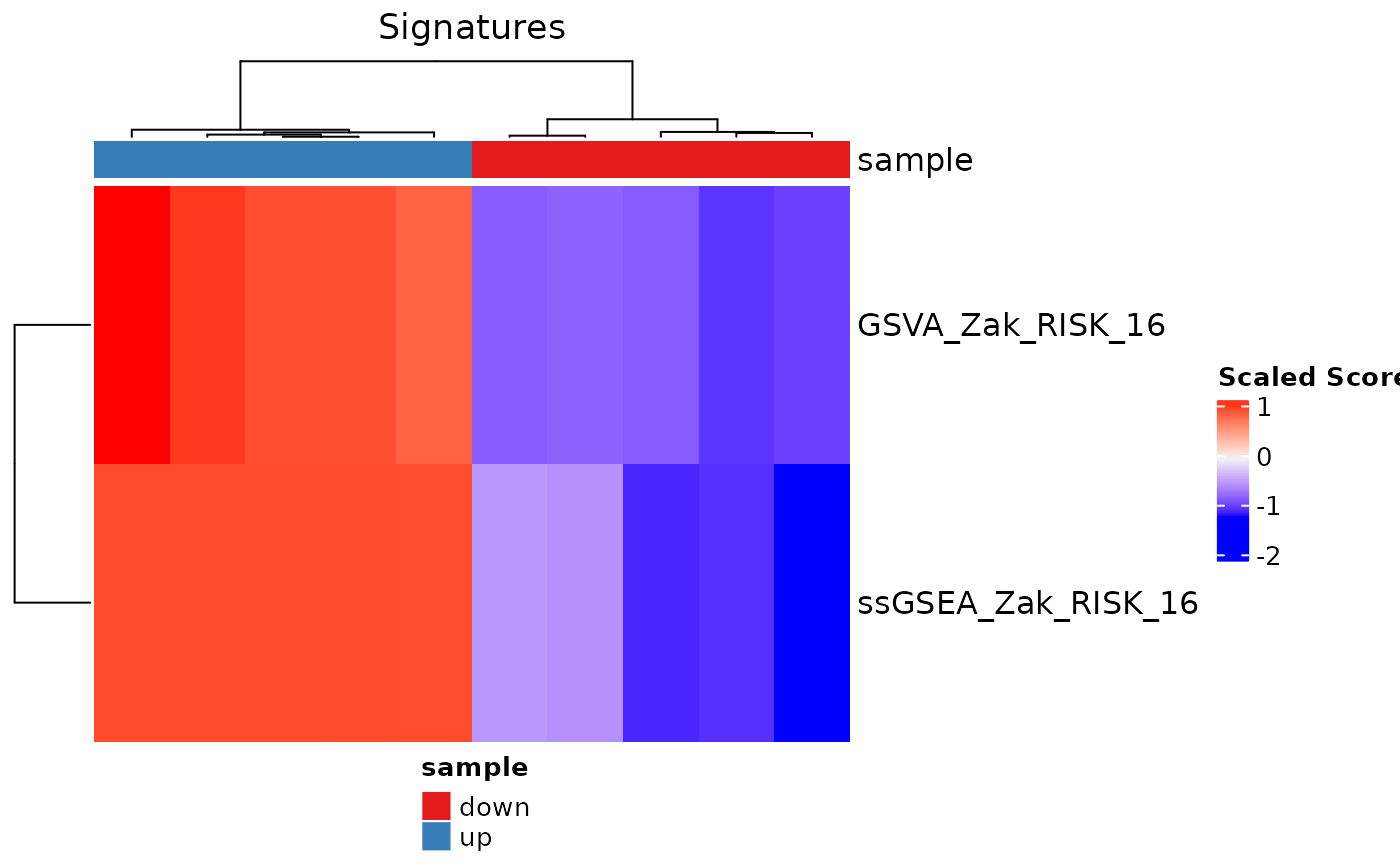
signatureHeatmap(res, signatureColNames = c("GSVA_Zak_RISK_16",
"ssGSEA_Zak_RISK_16"),
annotationColNames = "sample", scale = TRUE,
showColumnNames = FALSE, split_heatmap = "none")
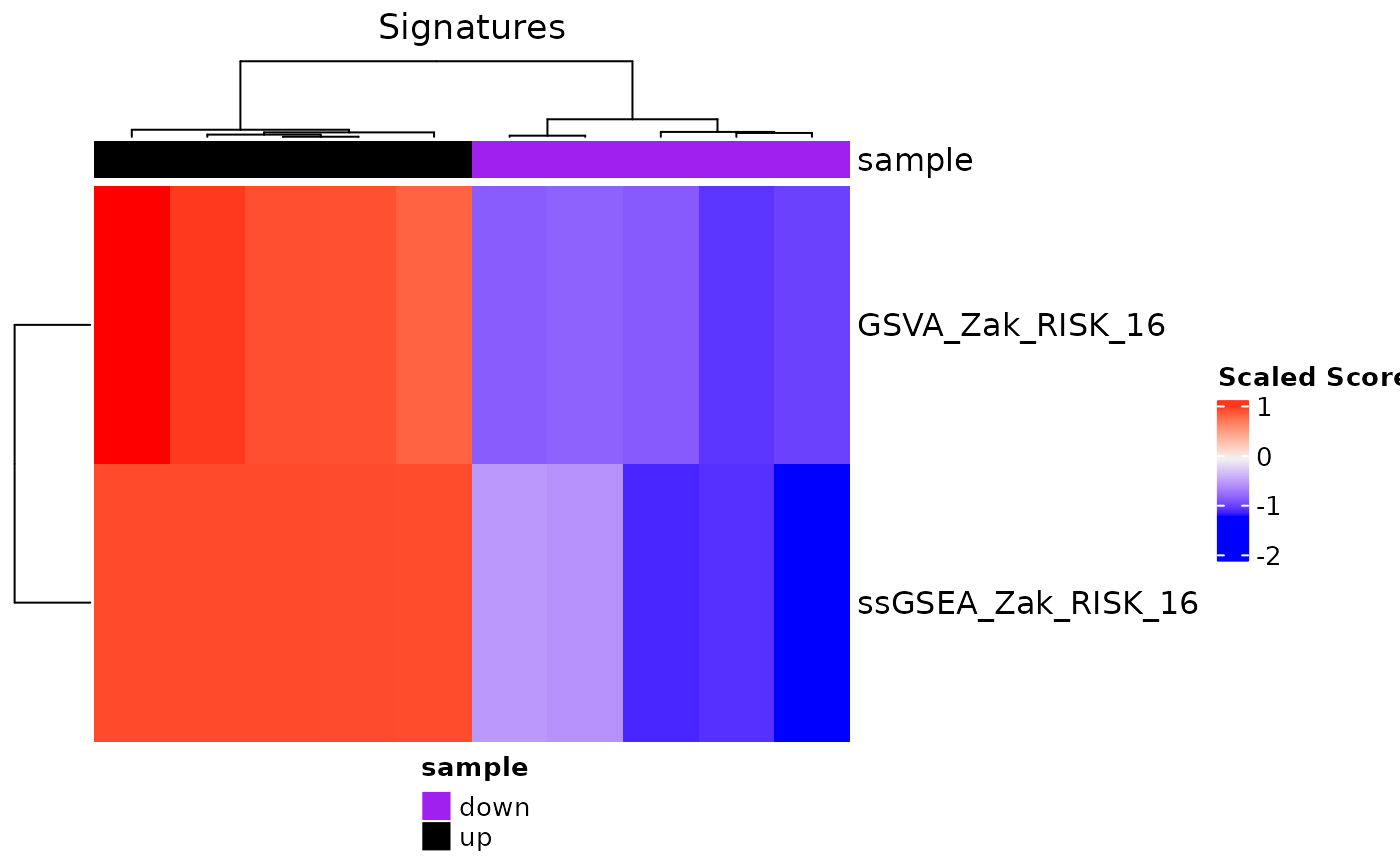
 # Example using custom colors for the annotation information
color2 <- stats::setNames(c("purple", "black"), c("down", "up"))
color.list <- list("sample" = color2)
signatureHeatmap(res, signatureColNames = c("GSVA_Zak_RISK_16",
"ssGSEA_Zak_RISK_16"),
annotationColNames = "sample", scale = TRUE,
showColumnNames = FALSE,
colList = color.list, split_heatmap = "none")
# Example using custom colors for the annotation information
color2 <- stats::setNames(c("purple", "black"), c("down", "up"))
color.list <- list("sample" = color2)
signatureHeatmap(res, signatureColNames = c("GSVA_Zak_RISK_16",
"ssGSEA_Zak_RISK_16"),
annotationColNames = "sample", scale = TRUE,
showColumnNames = FALSE,
colList = color.list, split_heatmap = "none")