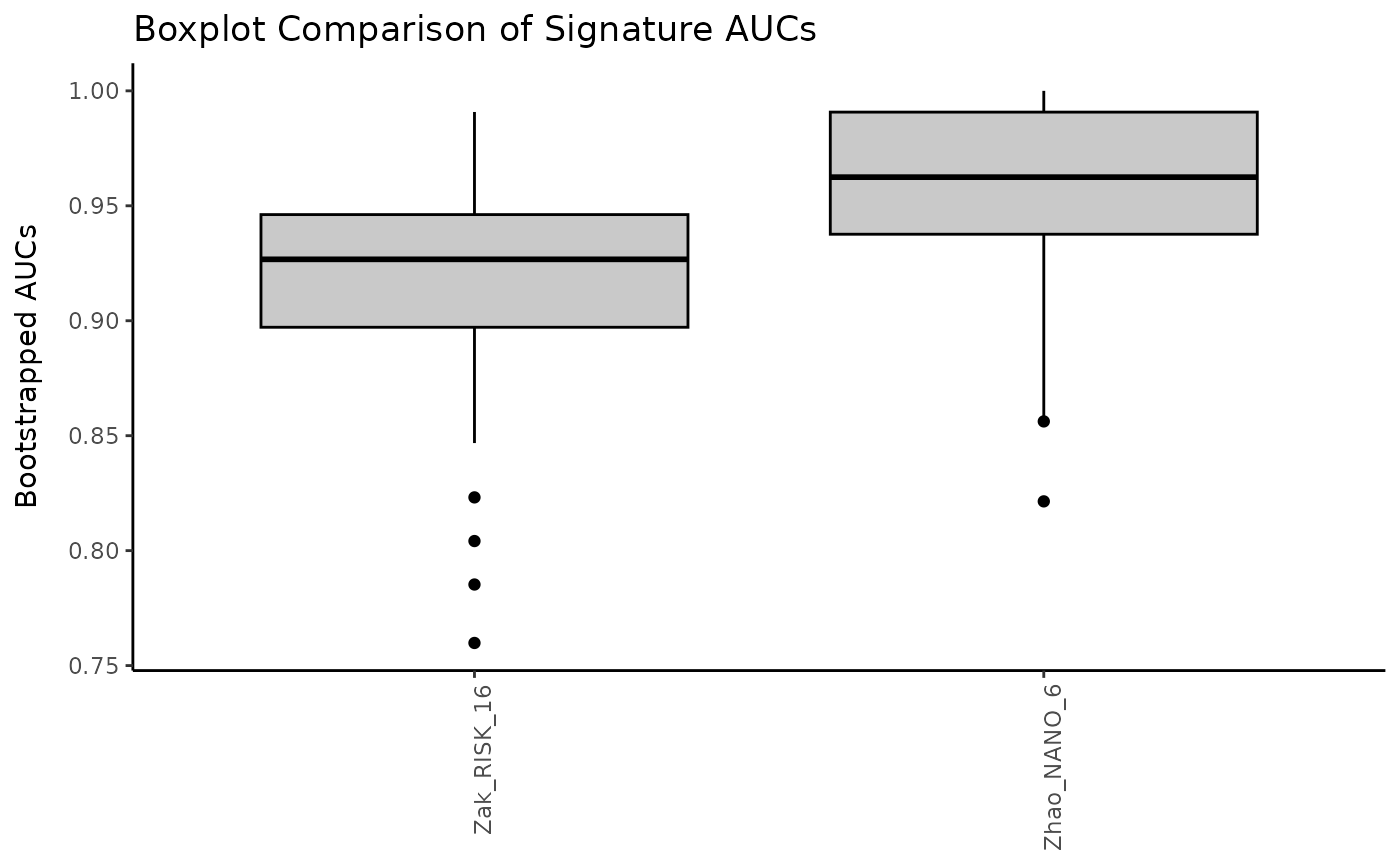
Create a comparison plot of boxplots for bootstrapped AUC values.
Source:R/bootstrap.R
compareBoxplots.RdPresent the results of AUC bootstrapping for a collection of scored signatures via boxplots.
Usage
compareBoxplots(
  SE_scored,
  annotationColName,
  signatureColNames,
  num.boot = 100,
  name = "Boxplot Comparison of Signature AUCs",
  pb.show = TRUE,
  abline.col = "red",
  fill.col = "gray79",
  outline.col = "black",
  rotateLabels = FALSE,
  violinPlot = FALSE
)
Arguments
- SE_scored
a
SummarizedExperimentobject with genes as the row features and signature scores in thecolData. There should also be a column of annotation data. Required.- annotationColName
a character string giving the column name in
colDatathat contains the annotation data. Required.- signatureColNames
a vector of column names in the
colDatathat contain the signature score data. Required.- num.boot
an integer indicating the number of times to bootstrap the data.
- name
a character string giving the overall title for the plot. The default is
"Boxplot Comparison of Signature AUCs".- pb.show
logical for whether to show a progress bar while running code. Default is
TRUE.- abline.col
the color to be used for the dotted line at AUC = 0.5 (the chance line). The default is
"red".- fill.col
the color to be used to fill the boxplots. The default is
"white".- outline.col
the color to be used for the boxplot outlines. The default is
"black".- rotateLabels
If
TRUE, rotate labels. Default isFALSE.- violinPlot
logical. Setting
violinPlot = TRUEcreates violin plots in place of boxplots. The mean and +/- 1 standard deviation are added to the violin plot interior for each signature. The default isFALSE.
Examples
# Run signature profiling
 choose_sigs <- TBsignatures[c("Zak_RISK_16", "Zhao_NANO_6")]
 prof_indian <- runTBsigProfiler(TB_indian[seq_len(25), ],
                                 useAssay = "logcounts",
                                 algorithm = "ssGSEA",
                                 signatures = choose_sigs,
                                 parallel.sz = 1)
#> Parameter update_genes is TRUE. Gene names will be updated.
#> Running ssGSEA
 # Create boxplots
 compareBoxplots(prof_indian, annotationColName = "label",
                 signatureColNames = names(choose_sigs), rotateLabels = TRUE)
#>
  |
  |                                                                      |   0%
  |
  |===================================                                   |  50%
  |
  |======================================================================| 100%