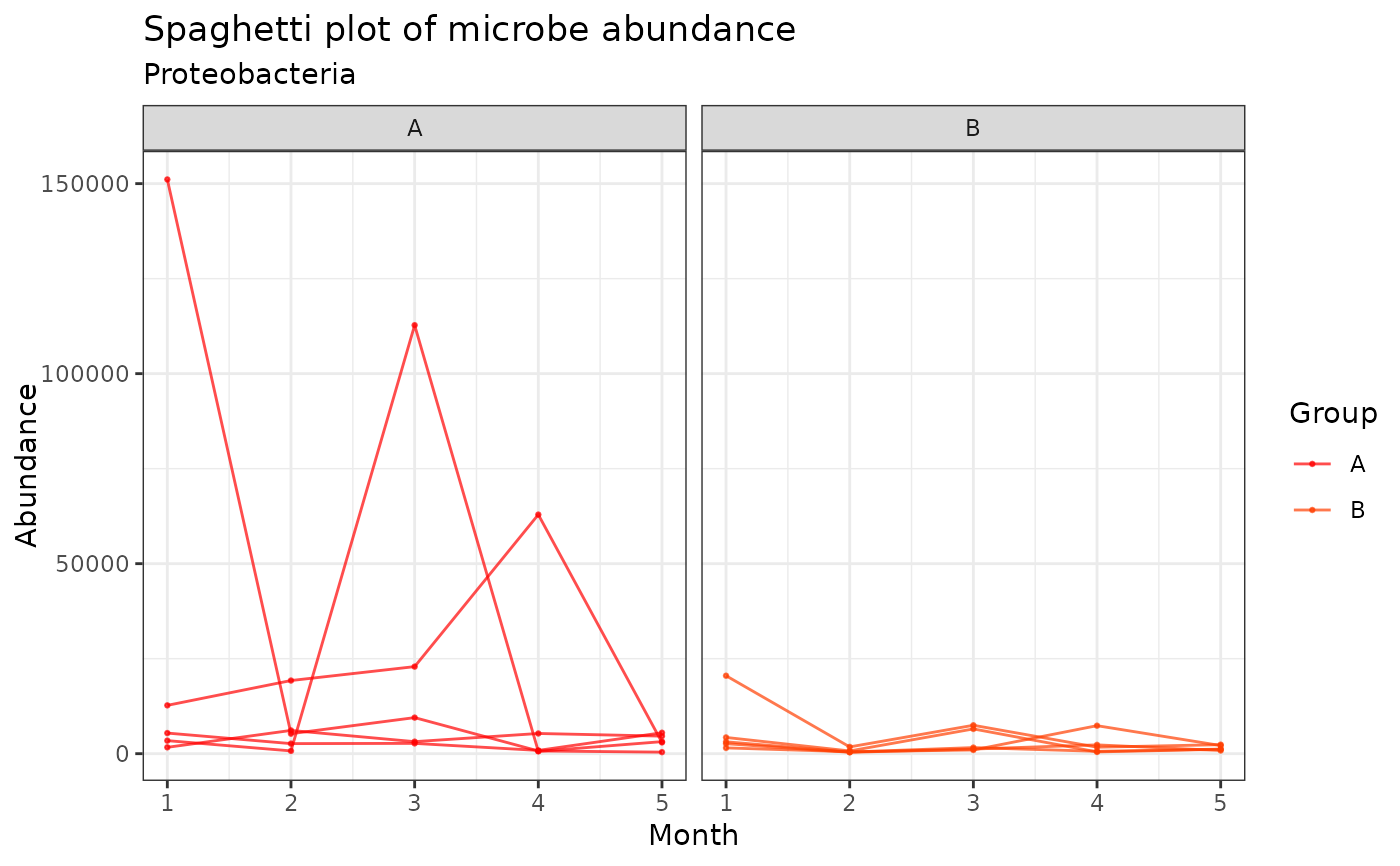
Plot a spaghetti volatility plot of microbial abundance for a given taxon
Source:R/plot_spaghetti.R
plot_spaghetti.RdThis function takes a MultiAssayExperiment object and returns a
spaghetti plot of microbial abundance delineated by a unit, such as
a subject.
Usage
plot_spaghetti(
  dat,
  covariate_time,
  covariate_1 = NULL,
  unit_var,
  taxon_level,
  which_taxon,
  palette_input = NULL,
  title = "Spaghetti Plot",
  subtitle = NULL
)
Arguments
- dat
A
MultiAssayExperimentobject specially formatted as an animalcules output.- covariate_time
Character string giving the name of the discrete time-based covariate in the metadata to group abundances by.
- covariate_1
Character string, the name of the covariate in `dat` by which to color and group samples. Default is
NULL.- unit_var
Character string, the name of the column delineating the unit on which the microbial abundances are changing over time. This is likely something akin to a subject that repeated measurements are made on.
- taxon_level
Character string indicating the level of taxonomy to aggregate the counts data. Must be the name of a column in
MultiAssayExperiment::rowData(dat).- which_taxon
Character string, the name of the taxon to plot at the specified taxon level.
- palette_input
A character vector of colors that is at minimum the same length of the number of taxa (specified with
taxon_level). The default isNULLand relies onggplot2's default scheme.- title
A character string providing the plot title.
- subtitle
A character string providing the plot subtitle. The default is
NULL.
Details
If further manipulation of specific parameters is desired, users can add
ggplot2 function calls to the output of the function.
Examples
in_dat <- system.file("extdata/MAE_small.RDS", package = "LegATo") |> readRDS()
all_taxa <- get_top_taxa(in_dat, "phylum")
plot_spaghetti(in_dat, taxon_level = "phylum", covariate_1 = "Group", covariate_time = "Month",
              unit_var = "Subject", which_taxon = all_taxa$taxon[1],
              palette_input = rainbow(25))